Nifty Trade Setup: Nifty showed a strong recovery after breaking the November low intraday and closed the last session of the calendar year on December 31 with a slight gain. The index defended the upward sloping support trend line on a closing basis for another session, raising hopes of a bullish return to the market. However, the overall sentiment remains bearish. Market experts suggest that Nifty may trade in the range of 23,400-24,000 in the upcoming few sessions of the New Year. If Nifty maintains the level of 23,500 on closing basis then a rise towards 23,900 is possible. Conversely, a decisive close below 23,500 could take the index towards 23,300, which is the November low.
Here we are giving you some such figures on the basis of which it will be easy for you to catch profitable deals.
Important level for Nifty 50 (23,658)
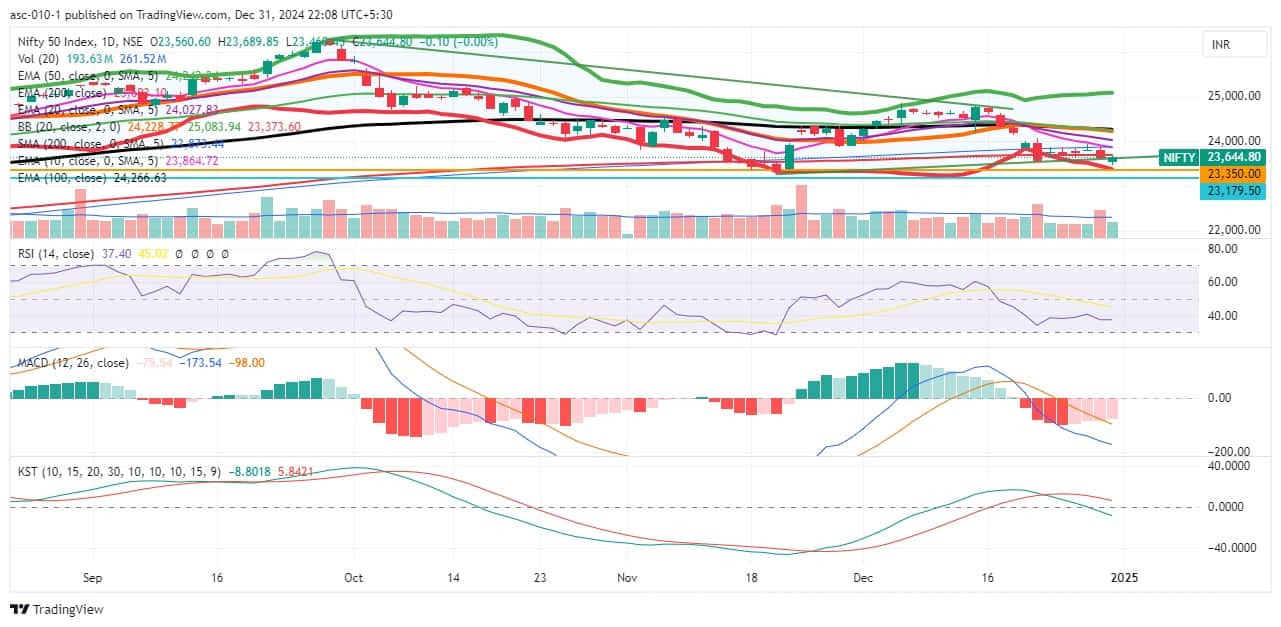
support based on pivot point : 23,511, 23,457 and 23,369
Registration based on pivot point: 23,666, 23,740 and 23,828
Nifty formed a bullish candlestick pattern with light upper and large lower shadows on the daily chart. This is a signal for a counterattack by the bulls after an attempted downside breakout. Despite this recovery, the index remains below all major moving averages. Furthermore, momentum indicators like RSI, MACD and KST are maintaining a negative trend, indicating underlying weakness in the market.
Key level for Bank Nifty (50,887)
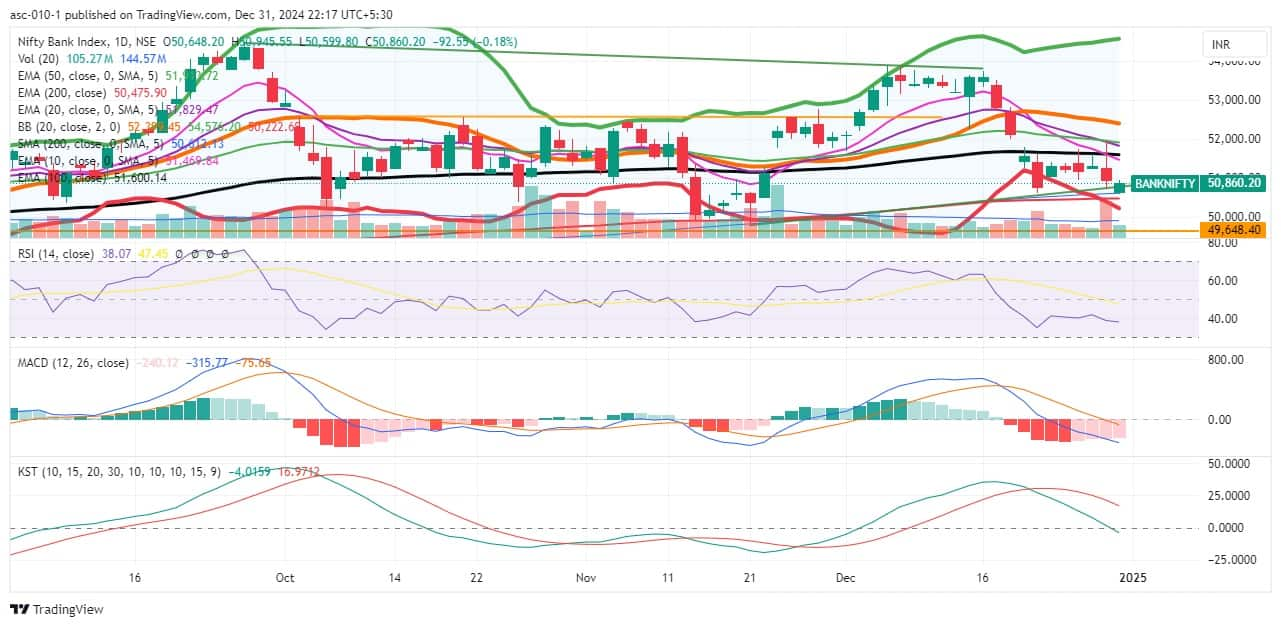
Registration based on pivot points: 50,892, 51,016, and 51,148
Support based on pivot points: 50,670, 50,588, and 50,456
Resistance based on Fibonacci retracement: 51,578, 52,128
Support based on Fibonacci retracement: 50,664, 49,787
Bank Nifty also formed a bullish candlestick pattern on the daily time frame after a strong recovery from the day’s low. It found support at the 200-day SMA and December 20 low, increasing the chances of an upside rally. However, the overall sentiment is bearish. The index is trading below the 10, 20, 50 and 100-day EMAs and within the lower band of Bollinger Bands. Momentum indicators remain in the negative zone, indicating a cautious approach.
nifty call option data
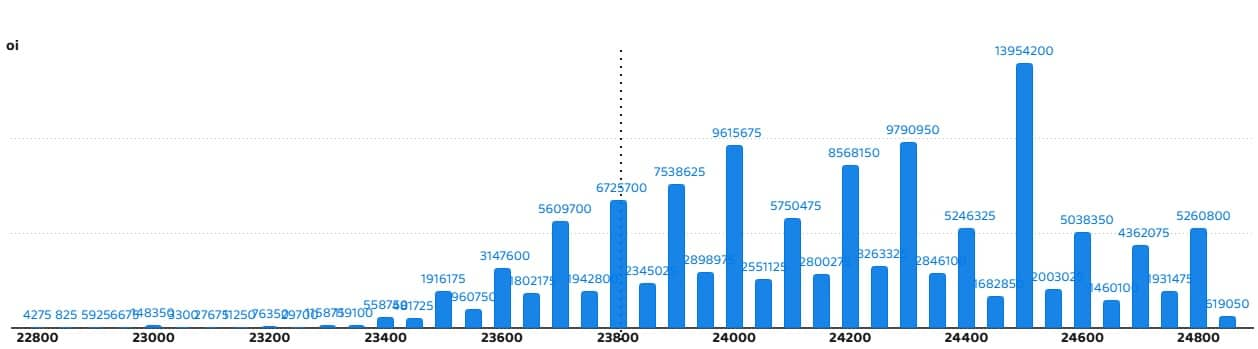
On weekly basis, maximum call open interest of 1.39 crore contracts has been seen at the strike of 24,500 which will act as an important resistance level in the coming trading sessions.
nifty put option data
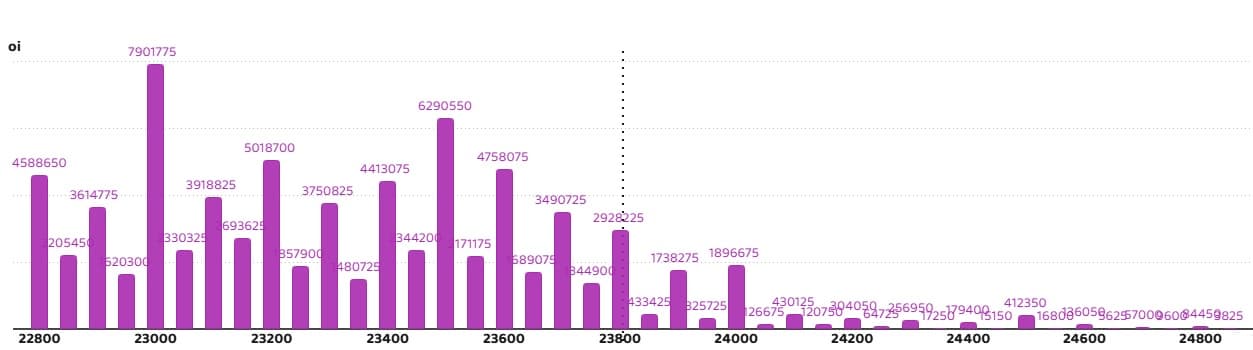
Maximum Put Open Interest of 79.01 lakh contracts has been seen at the strike of 23,000 which will act as an important support level in the coming trading sessions.
bank nifty call option data
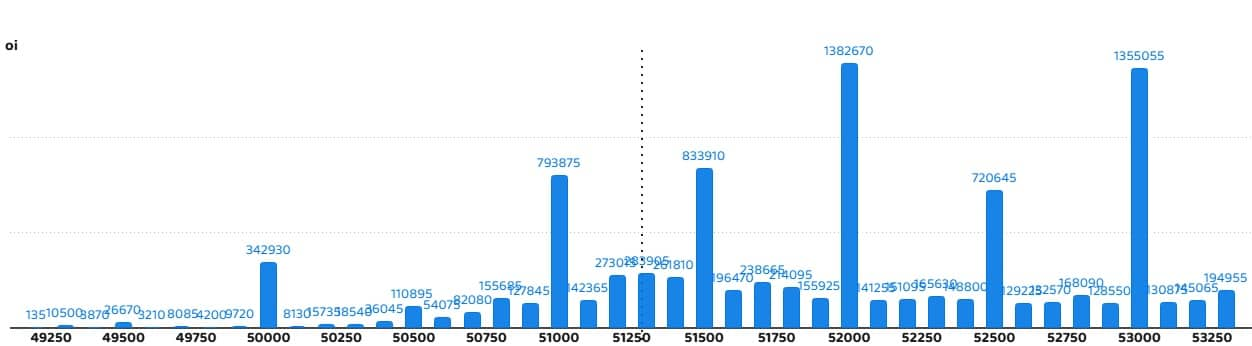
Bank Nifty has seen a maximum call open interest of 13.82 lakh contracts at the strike of 52,000, which will act as an important resistance level in the coming trading sessions.
bank nifty put option data
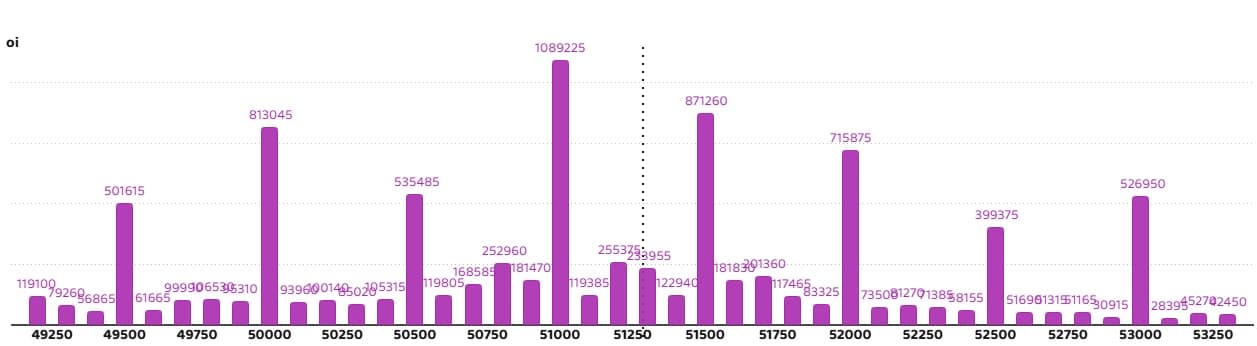
Maximum Put Open Interest of 10.89 lakh contracts has been seen at the strike of 51,000 which will act as an important resistance level in the coming trading sessions.
Consolidated Outlook for 2025: Positive returns in the market for the ninth consecutive year, know from brokerage how the situation may be in 2025
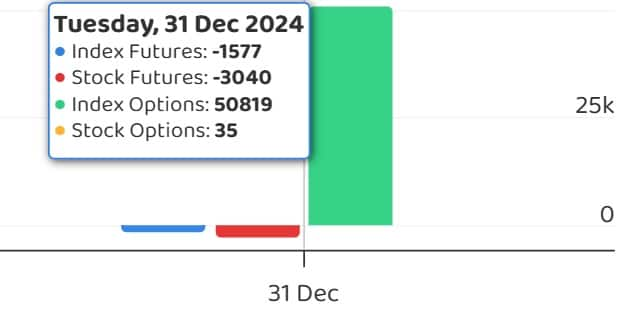
FII and DII fund flows
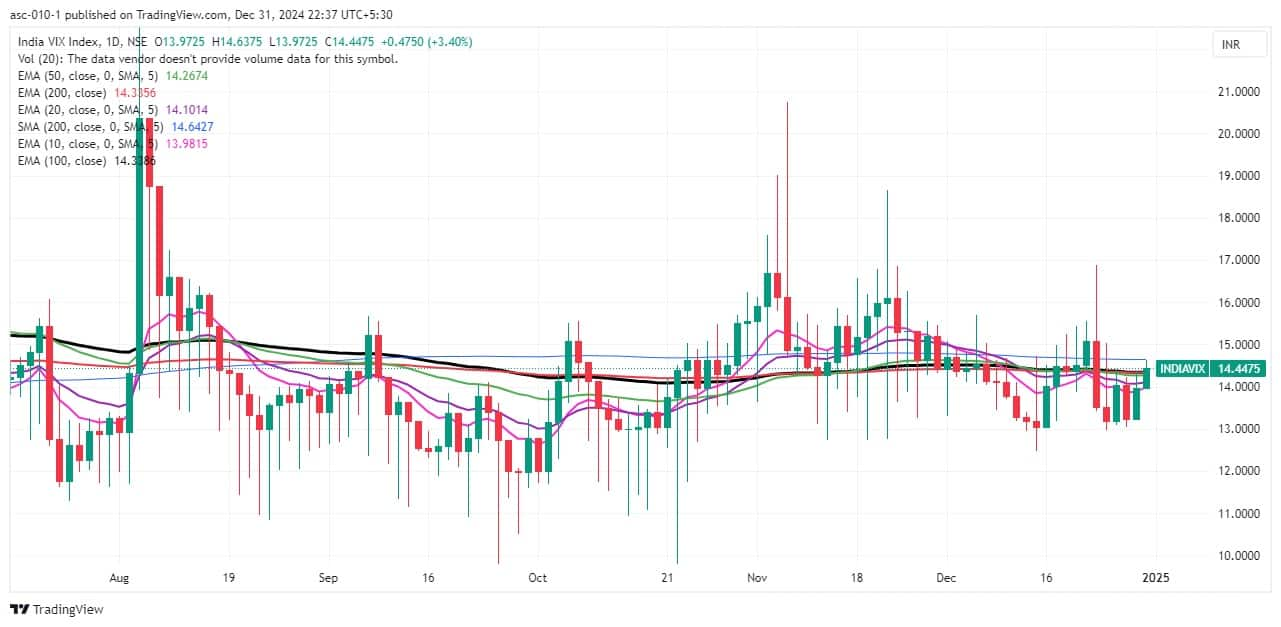
India VIX, which measures market volatility, went above 14 and closed at 14.45, up 3.4 per cent. This is a signal of caution for bulls. If VIX remains above this level, bulls should remain cautious.
put call ratio
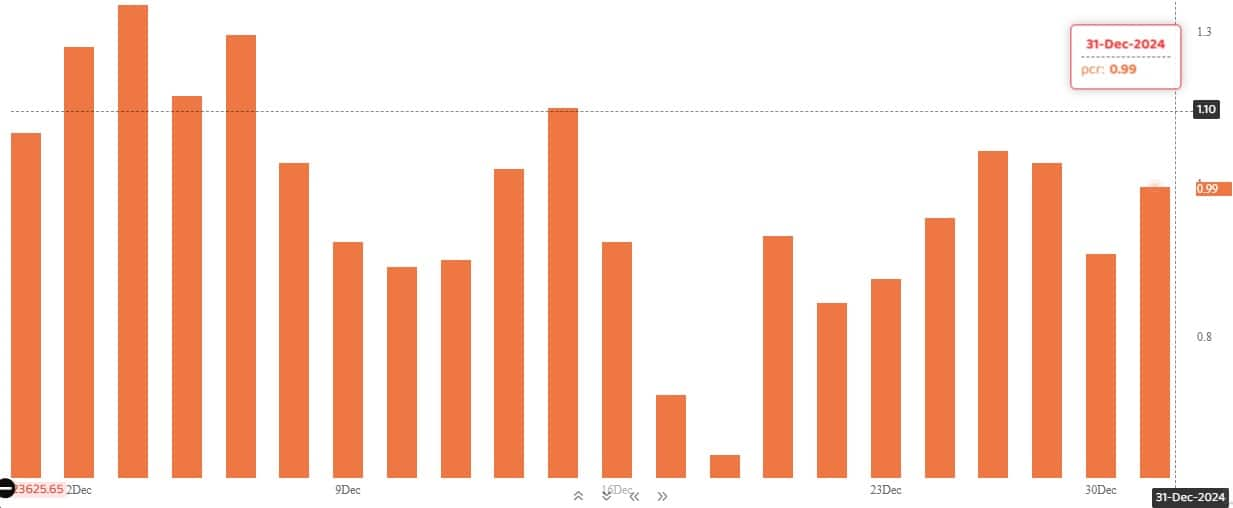
The Nifty Put-Call Ratio (PCR), which reflects market mood, increased to 0.99 on December 31 from 0.88 in the previous session. It is noteworthy that PCR going above 0.7 or crossing 1 is generally considered a sign of bullish sentiment. Whereas a ratio falling below 0.7 or towards 0.5 indicates bearish sentiment.
Stocks covered under F&O ban
Restricted securities under the F&O segment include those companies whose derivative contracts exceed 95 per cent of the market wide position limit.
Newly included stocks in F&O ban: nobody
Stocks already included in F&O restrictions: nobody
Stocks removed from F&O ban: nobody
Disclaimer: The views expressed on Moneycontrol.com are the personal views of the experts. The website or management is not responsible for this. Money Control advises users to seek the advice of a certified expert before taking any investment decision.