Stock market: There was a downward trend in the market throughout the last week. There was a 1.5 percent decline on December 20 and a 4.8 percent decline for the entire week. Nifty 50 index has fallen below 200-day EMA (23,700) on closing basis. Besides, negative trend has also been seen in momentum indicators. Market experts say that if Nifty remains below 23,700, then it cannot be ruled out that Nifty will touch the November low (23,263) in the upcoming trading sessions. However, in case of a bounce, the first resistance is expected at 23,900. After that the next registration will be at 24,065.
Here we are giving you some such figures on the basis of which it will be easy for you to catch profitable deals.
Key support and resistance levels for Nifty
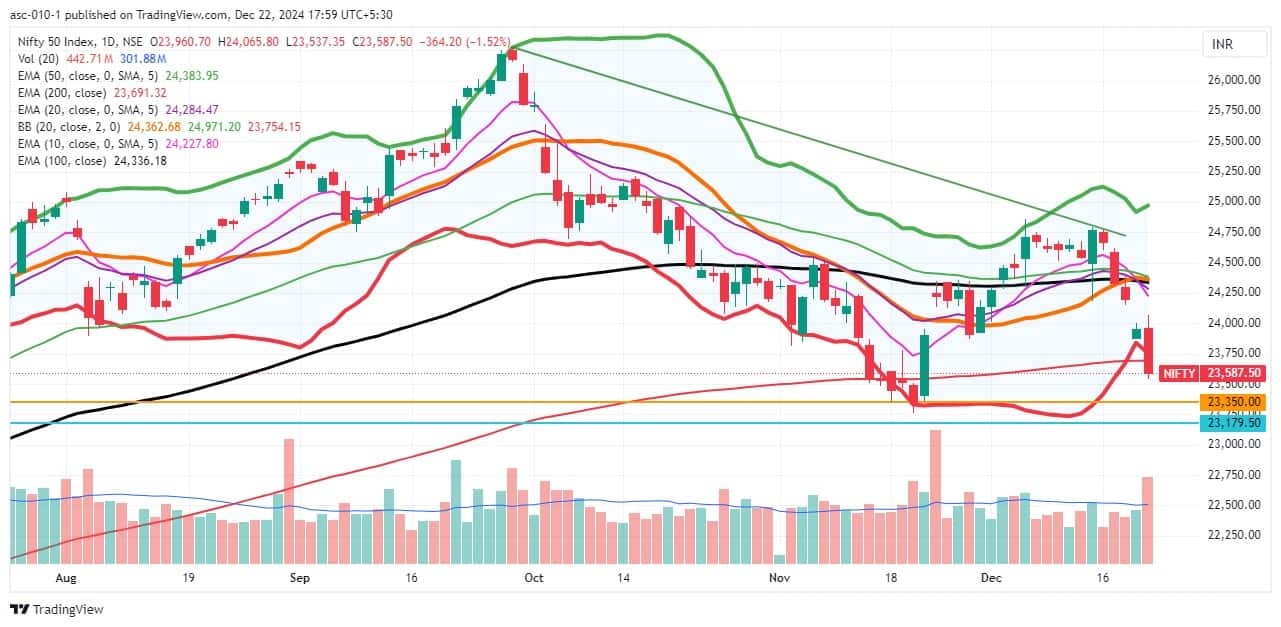
Support based on pivot point: 23,528, 23,404 and 23,202
Registration based on pivot point: 23,932, 24,057 and 24,259
Nifty formed a long bearish candlestick pattern with above average volumes on the daily chart. After Friday’s decline, the index is now trading below all important moving averages, with the 200-day EMA being the last EMA broken on Friday. Furthermore, the index is trading below the lower end of the Bollinger Bands, while the momentum indicators – RSI (Relative Strength Index) at 34 and MACD (Moving Average Convergence Divergence) are falling below the zero line with a negative crossover. All these are indicating weakness.
bank nifty
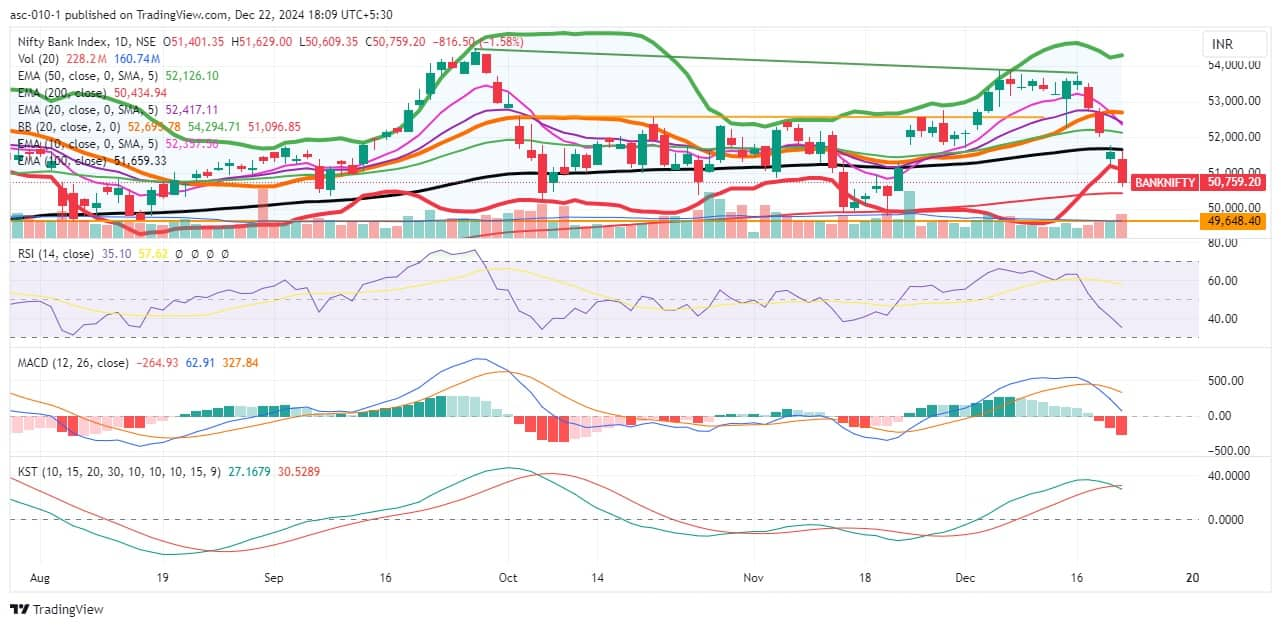
Registration based on pivot points: 51,389, 51,629 and 52,019
Support based on pivot points: 50,610, 50,369 and 49,980
Resistance based on Fibonacci retracement: 51,580, 52,131
Support based on Fibonacci retracement: 50,664, 49,787
There was correction in Bank Nifty also throughout the week. Due to which it formed a big bearish candlestick pattern with lower high and lower low for the fourth consecutive trading session on the daily time frame. The banking index is also trading below the lower band of Bollinger Bands and is 324 points away from the 200-day EMA (50,435), while it is already below the 10, 20, 50 and 100-day EMA. The RSI has fallen to 35 and the MACD is near the zero line with a negative trend. All these indicators are pointing towards weakness. The index declined 1.6 percent on Friday. It declined 5.3 percent on a weekly basis with above average volumes.
nifty call option data
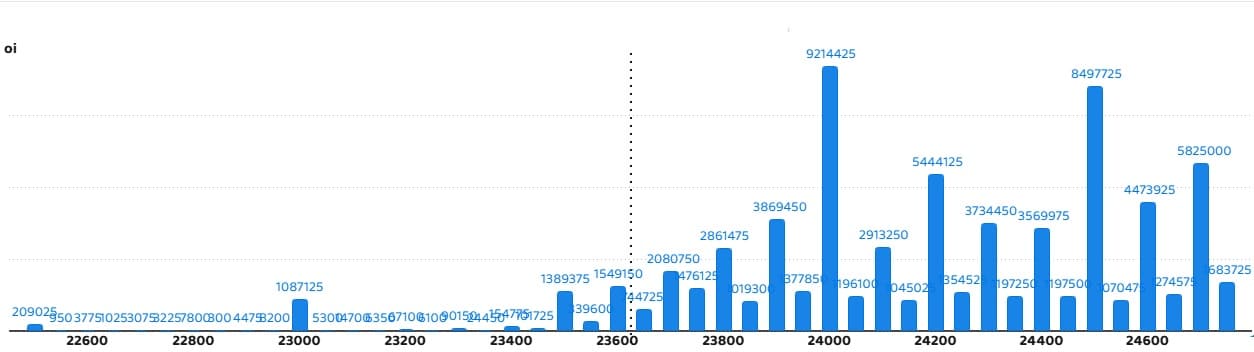
Maximum call open interest of 92.14 lakh contracts has been seen in Nifty at the strike of 24,000, which will act as an important resistance level in the coming trading sessions.
nifty put option data
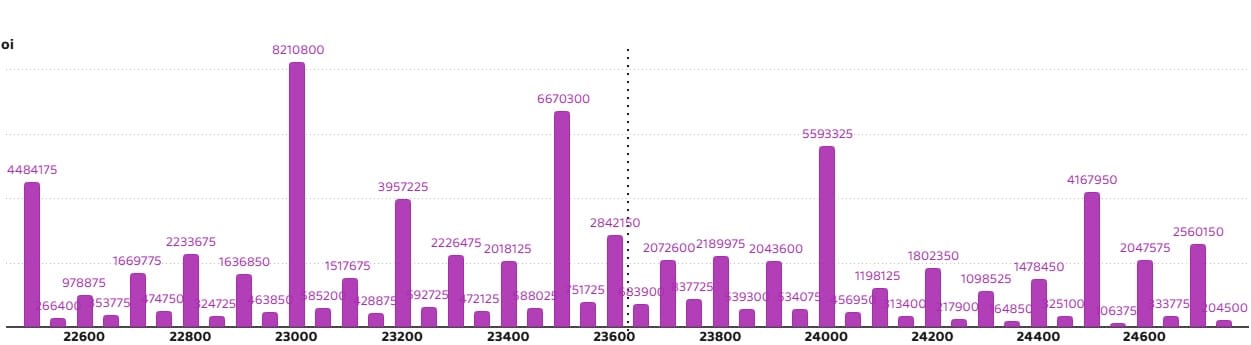
Maximum Put Open Interest of 82.1 lakh contracts has been seen at the strike of 23,000 which will act as an important support level in the coming trading sessions.
bank nifty call option data
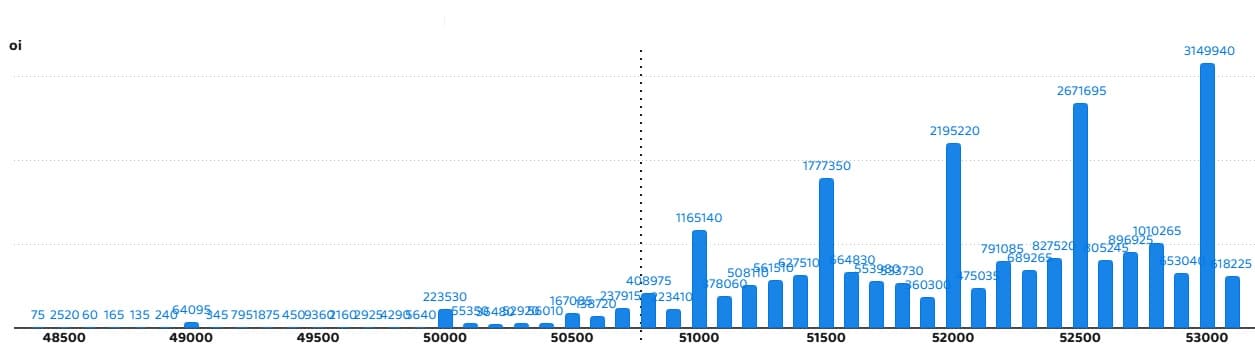
Bank Nifty has seen a maximum call open interest of 31.49 lakh contracts at the strike of 53,000, which will act as an important resistance level in the coming trading sessions.
bank nifty put option data
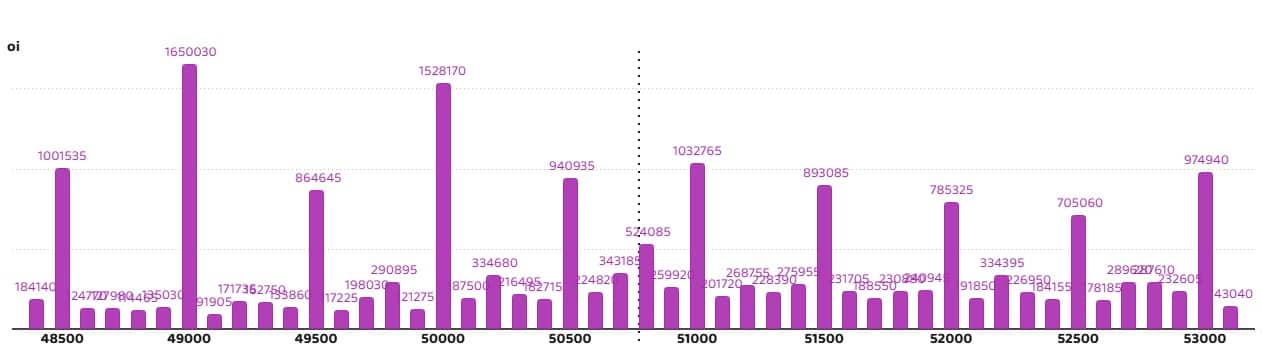
Bank Nifty has seen a maximum put open interest of 16.5 lakh contracts at the strike of 49,000, which will act as an important support level in the coming trading sessions.
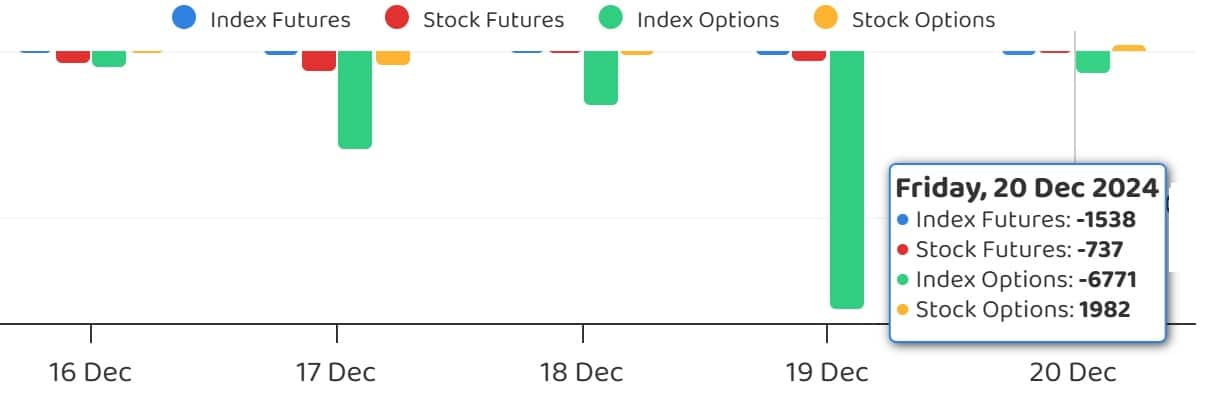
FII and DII fund flows
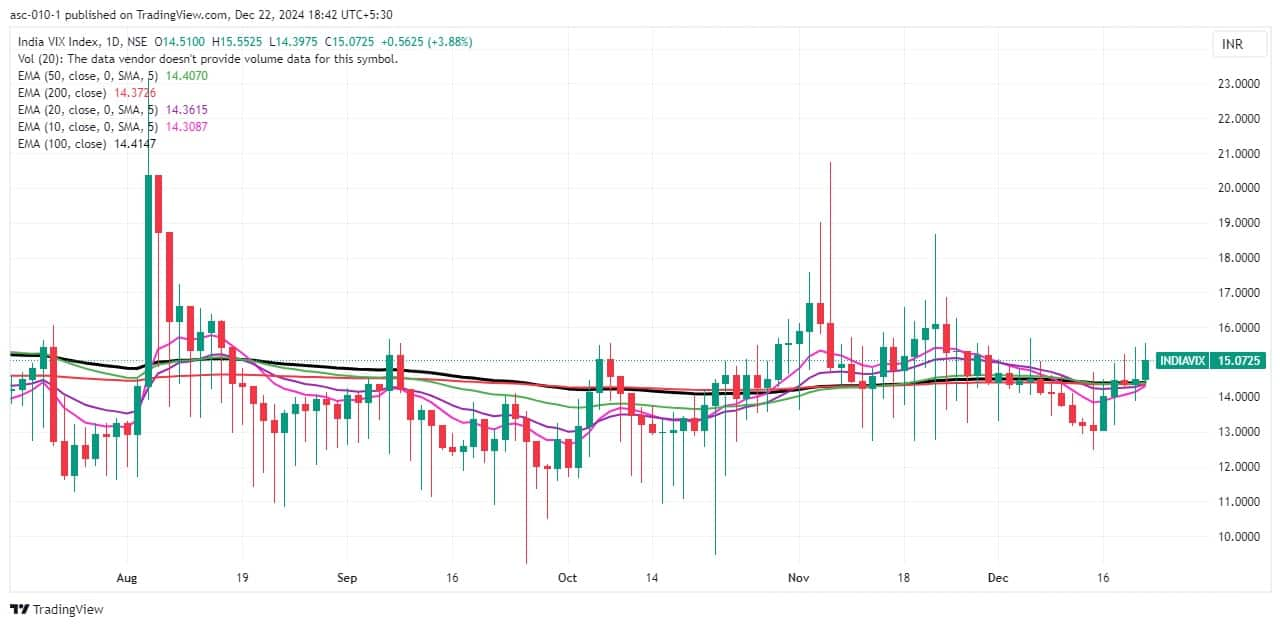
On Friday, volatility index India VIX rose by 3.88 per cent to 15.07 from the previous level of 14.51, which may create more trouble for the bulls. For the bulls to feel comfortable again, the fear index will have to fall to around 12-13.
Market trend: Focus on shares instead of index, Reliance will outperform Nifty in 2025 – Mehboon Irani
put call ratio
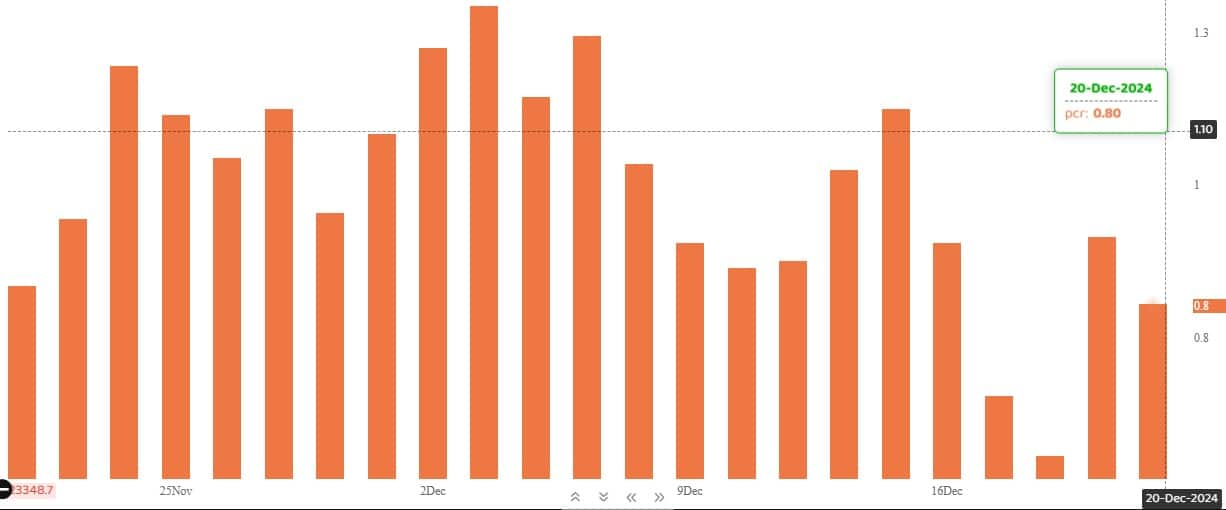
The Nifty put-call ratio (PCR), which reflects market sentiment, fell to 0.8 on December 20 from 0.91 in the previous session. It is noteworthy that PCR going above 0.7 or crossing 1 is generally considered a sign of bullish sentiment. Whereas a ratio falling below 0.7 or towards 0.5 indicates bearish sentiment.
Stocks covered under F&O ban
Restricted securities under the F&O segment include companies whose derivative contracts exceed 95 per cent of the market-wide position limit.
Newly included stocks in F&O ban: RBL Bank
Stocks already included in F&O restrictions: Bandhan Bank, Granules India, Hindustan Copper, Manappuram Finance, SAIL
Stocks removed from F&O ban: NMDC & PVR INOX
Disclaimer: The views expressed on Moneycontrol.com are the personal views of the experts. The website or management is not responsible for this. Money Control advises users to seek the advice of a certified expert before taking any investment decision.