Stock market: After selling throughout the last week, a gain of 0.70 percent was seen in the market on December 23. Nifty 50 index climbed above the 200-day EMA (23,700), which is important for its further journey. However, the momentum indicator MACD (Moving Average Convergence Divergence), has shown a negative trend on both daily and weekly charts. On the upside, Nifty may face resistance at 23,850. After that the next big resistance is at 24000. Market experts say that on the downside, Nifty is expected to take immediate support at 23,700, after which the next major support will be at 23,550 (near last week’s low).
Here we are giving you some such figures on the basis of which it will be easy for you to catch profitable deals.
Key support and resistance levels for Nifty
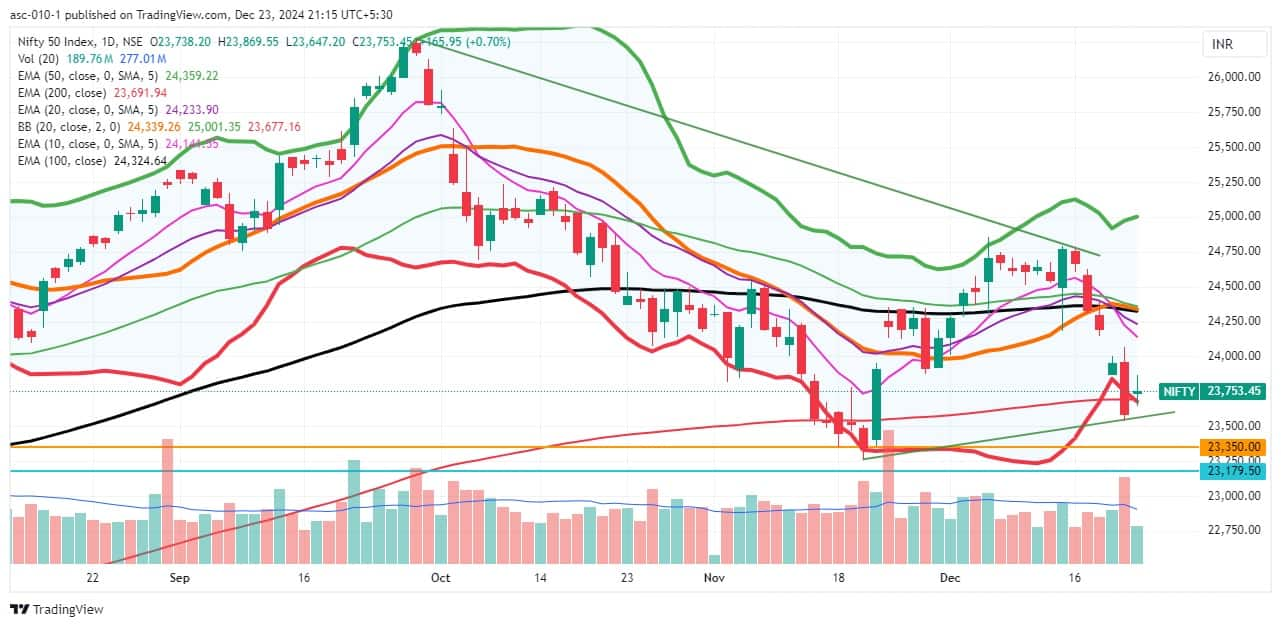
Important level for Nifty 50 (23,753)
Support based on pivot point: 23,672, 23,619 and 23,534
Registration based on pivot point: 23,842, 23,894 and 23,979
Nifty has formed a doji like and inside bar candlestick pattern on the daily chart. This is an indication of indecision between bulls and bears. Momentum indicator RSI (Relative Strength Index) stood at 38.6, which is in the lower band. This is a negative sign. Moreover, Nifty is still below important key moving averages (10, 20, 50 and 100-day EMA), though it is slightly above the 200-day EMA.
bank nifty
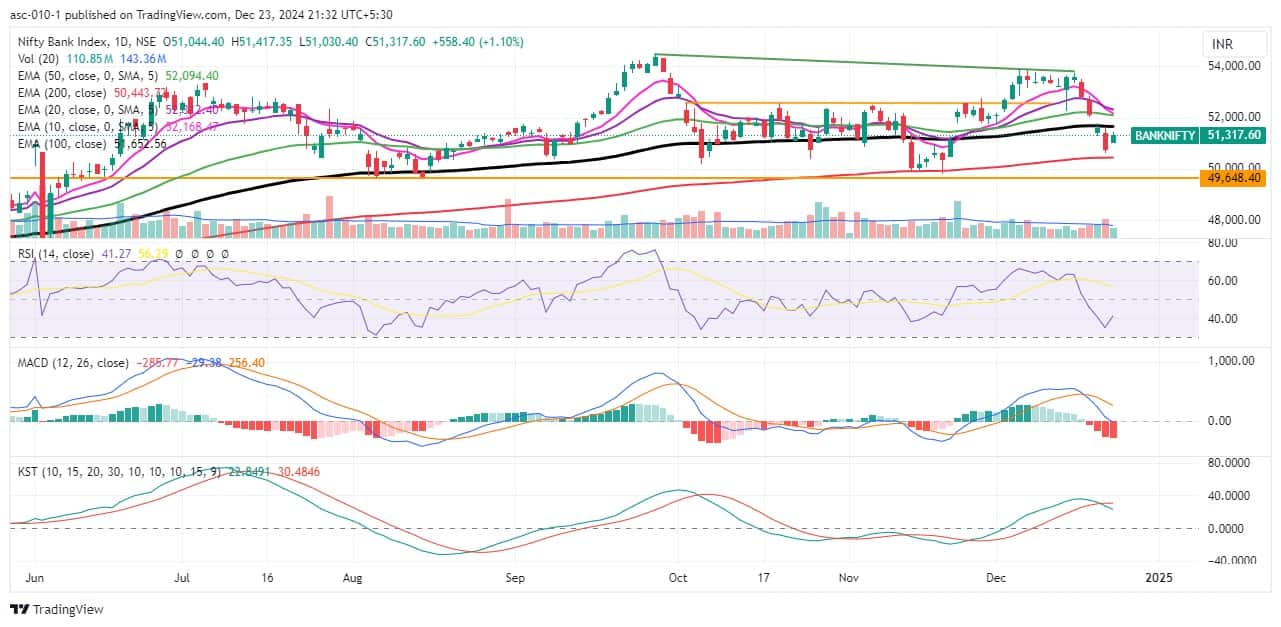
Important level for Bank Nifty (51,318)
Registration based on pivot points: 51,403, 51,494, and 51,642
Support based on pivot points: 51,107, 51,016, and 50,868
Resistance based on Fibonacci retracement: 51,864, 52,246
Support based on Fibonacci retracement: 50,672, 49,787
Bank Nifty outperformed the benchmark Nifty and formed a bullish candlestick pattern like Bullish Harami which is a trend reversal pattern. However, sentiment remains bearish as the banking index is trading below all important moving averages (except 200-day EMA) and 50% Fibonacci retracement levels (from November low to December high) .
nifty call option data
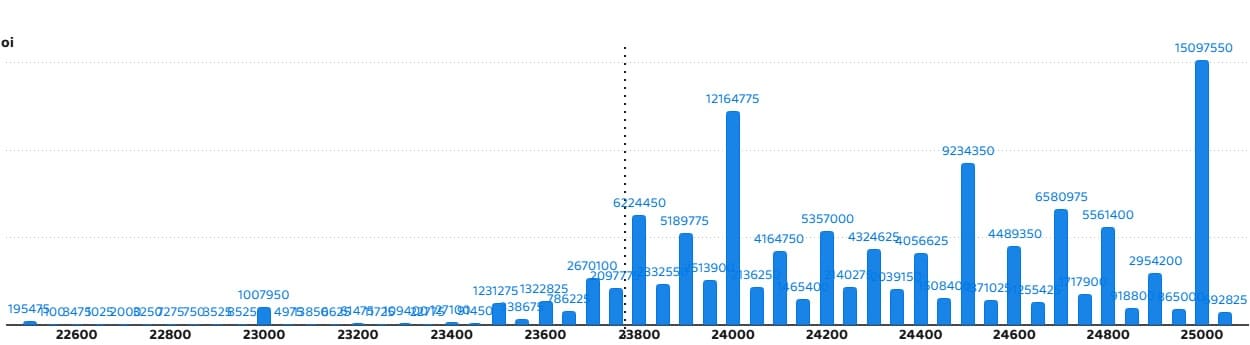
Maximum call open interest of 1.5 crore contracts has been seen in Nifty at the strike of 25,000, which will act as an important resistance level in the coming trading sessions.
nifty put option data
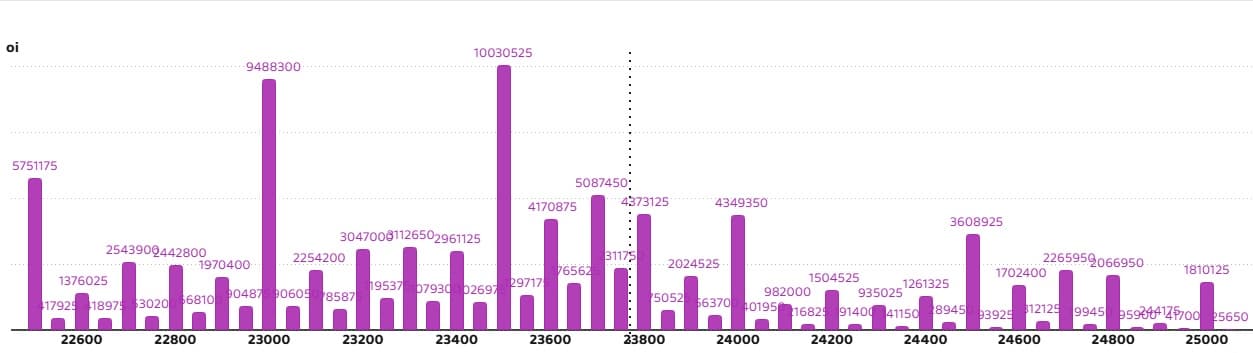
A maximum put open interest of 1 crore contracts has been seen at the strike of Rs 23,500, which will act as an important support level in the coming trading sessions.
bank nifty call option data
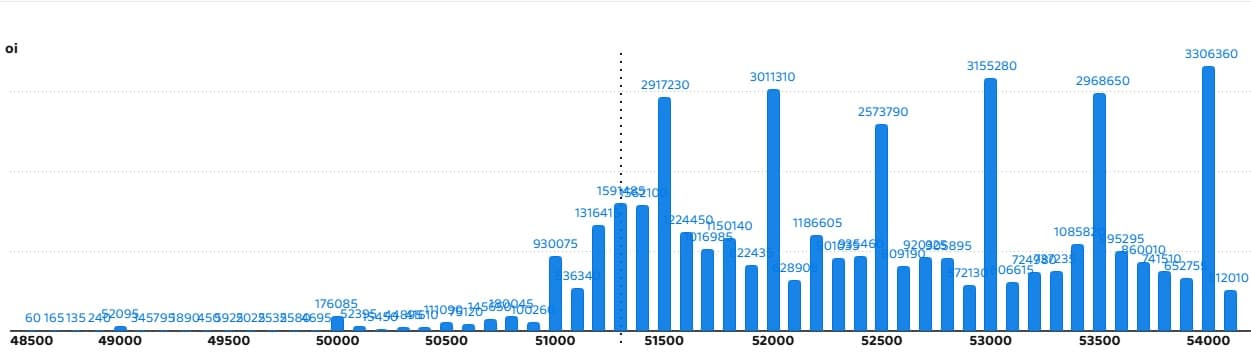
Bank Nifty has seen a maximum call open interest of 33.06 lakh contracts at the strike of 54,000, which will act as an important resistance level in the coming trading sessions.
bank nifty put option data
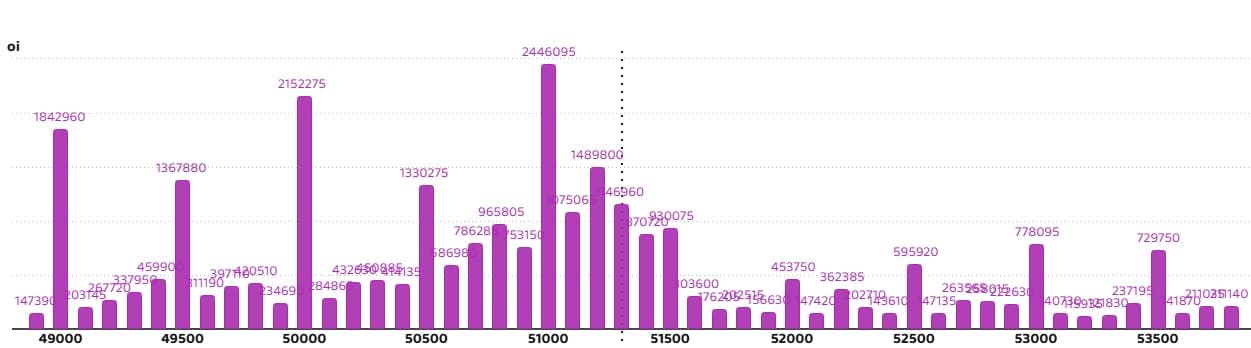
Bank Nifty has seen a maximum put open interest of 24.46 lakh contracts at the strike of 51,000, which will act as an important support level in the coming trading sessions.
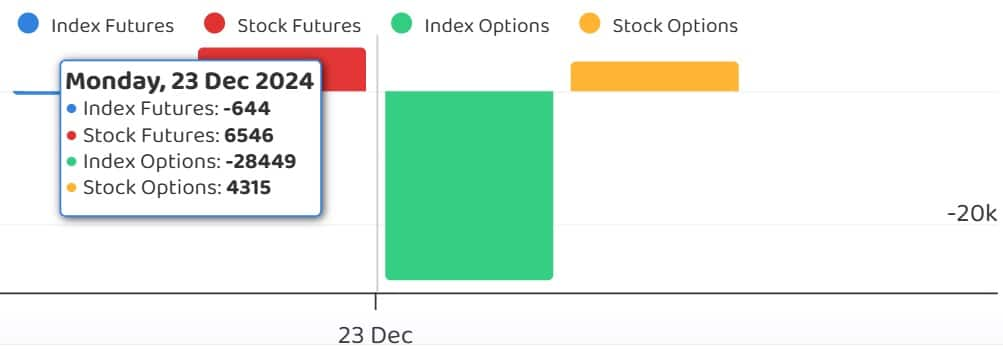
FII and DII fund flows
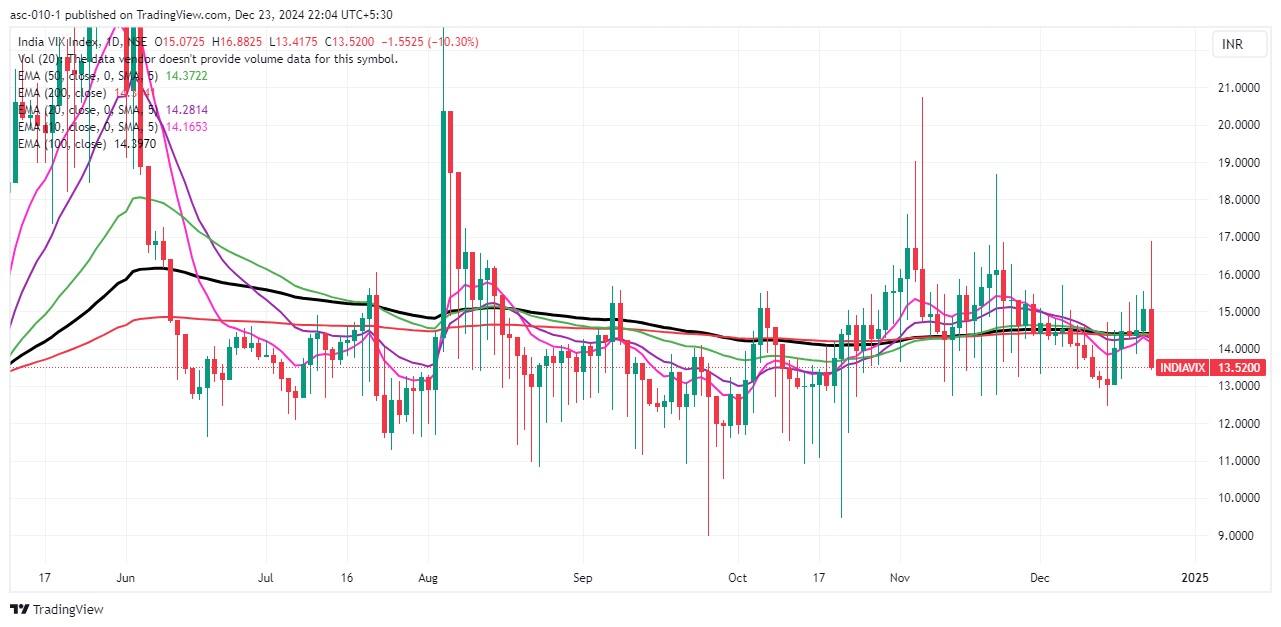
There has been a sharp decline of 10.3 percent in the volatility index India VIX. It has fallen to 13.52 from the previous level of 15.07. Due to which the trend has become more favorable for the bulls.
put call ratio
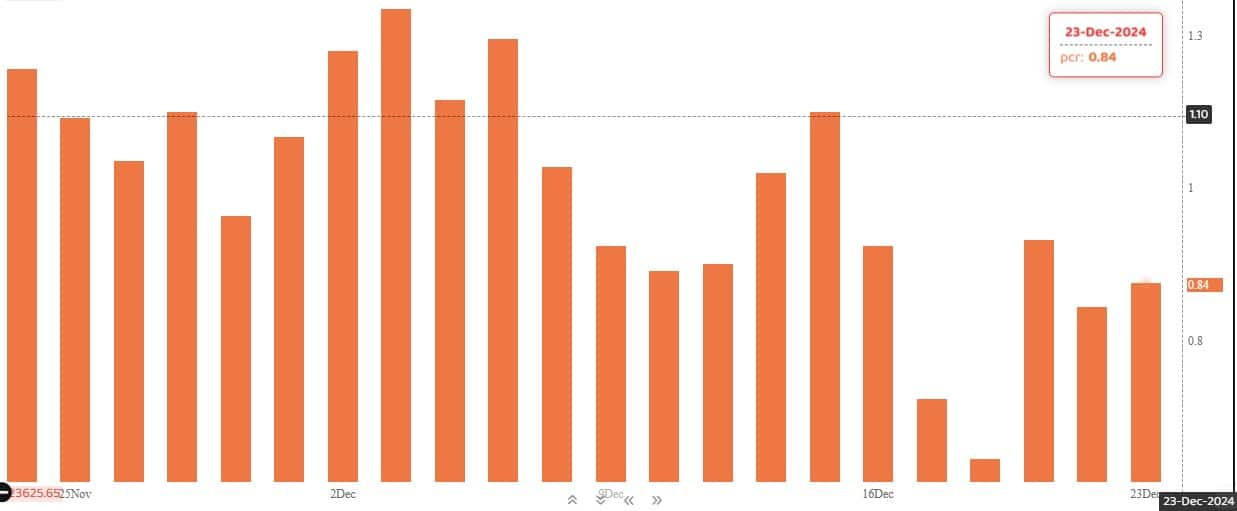
The Nifty put-call ratio (PCR), which reflects market sentiment, rose to 0.84 on December 23 from 0.8 in the previous session. It is noteworthy that PCR going above 0.7 or crossing 1 is generally considered a sign of bullish sentiment. Whereas a ratio falling below 0.7 or towards 0.5 indicates bearish sentiment.
Experts views: Bullish Harami cross pattern on daily chart is giving bullish signals, smart recovery can be seen in the market
Stocks covered under F&O ban
Restricted securities under the F&O segment include companies whose derivative contracts exceed 95 per cent of the market-wide position limit.
Newly included stocks in F&O ban: nobody
Stocks already included in F&O restrictions: Bandhan Bank, Granules India, Hindustan Copper, Manappuram Finance, RBL Bank
Stocks removed from F&O ban: SAIL
Disclaimer: The views expressed on Moneycontrol.com are the personal views of the experts. The website or management is not responsible for this. Money Control advises users to seek the advice of a certified expert before taking any investment decision.